Understanding Camera Histogram
For me, Camera Histogram is a very useful tool in the age of digital photography. Most of the amateur photographers don’t know about histogram or don’t know how to read it.
Nowadays, almost all digital cameras come with the feature of displaying histogram. In this article, I will help you on how to read a histogram.
Understanding the camera histogram will help you to expose your photograph correctly.
What is a Camera Histogram?
A histogram is basically a tonal distribution graph which graphically represents the pixels exposed in an image.
What are the Different Types of Histogram?
There are two types of histogram.
1. Luminance or Brightness Histogram
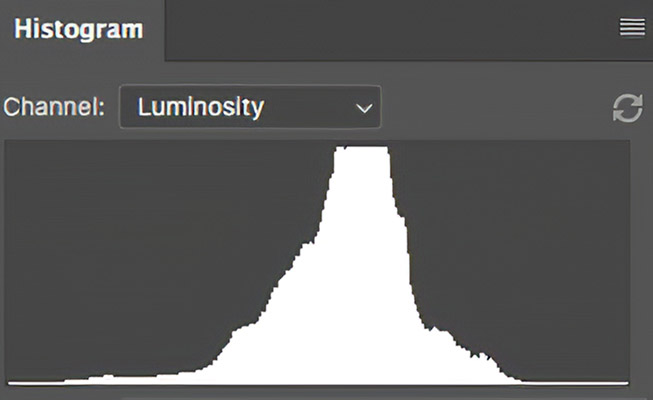
As the name suggests, this one shows the luminous intensity level or the brightness levels in the picture.
Luminance histogram is useful to get an idea of the exposure of the image in that particular lighting conditions with the camera settings.
You can make use of this graph to get the perfect exposure for your image.
2. RGB Histogram
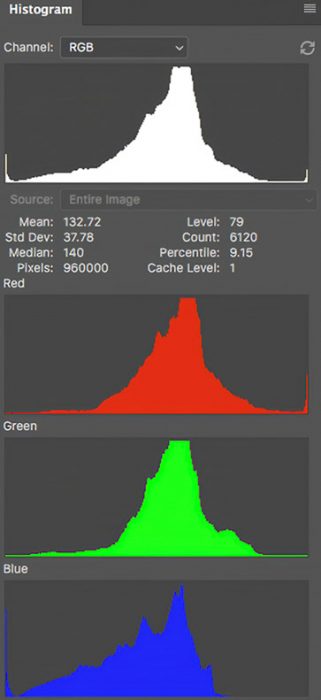
As the name suggests, RGB Histogram displays the information of the primary colours, Red, Green and Blue in the picture.
It will give you an idea of the colours captured in the picture. Based on the overlapping of these primary colours, you can see the distribution of all the colours.
Overlapping of all the three colours is shown in grey colour.
All DSLR cameras and mirrorless cameras shows both RGB histogram as well as luminance histogram for an image.
Why use a Camera Histogram?
Now the question would be, why use a histogram?
We can always have a look at the photo on the LCD display for the exposure of the image. Nowadays, most of the cameras come with an LCD display.
Here, the problem is that the LCD display can fool you sometimes since it comes with adjustable brightness. So, the exposure shown for the photograph in the display would be based on the LCD brightness level which we have set. It will result in a wrongly exposed final image.
During my initial days of photography, I used to check the image on my camera LCD screen for the exposure.
When I am shooting outdoors on bright sunny days, I find that the image is correctly exposed. Later when I check the exposure of the same image indoor, I found that the I have blown out the whites and highlights in the image.
It has happened to me many times when I used my camera LCD screen for checking the exposure.
Once I learned the Histogram, I always check the correctness of the exposure by looking at the histogram of the image.
So, use Histogram to make sure that the image is rightly exposed. Avoid using LCD display alone for checking the exposure.
How to Read a Histogram?
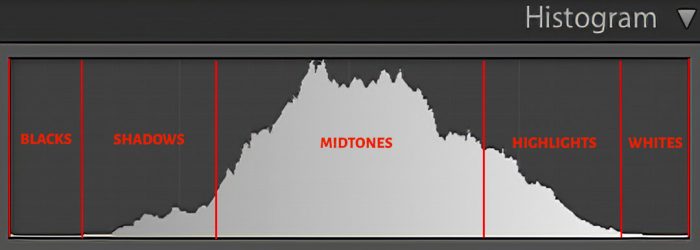
In the histogram shown above, we can divide it vertically into 5 sections.
The section on the extreme right represents the whites and the one on the extreme left shows the dark or black section in your image.
Centre portion represents the Midtones. The section in between the Blacks and Midtones represent the Shadows and the one in between Midtones and Whites represent the Highlights.
Now, we got an idea of what all things are represented on the horizontal axis. Let us have a look at the vertical axis. This axis represents the tonal intensity. It is basically the number of pixels in that particular tone.
What is an Ideal Histogram?
There is nothing like an ideal histogram. It varies according the lighting conditions.
The histogram for a white subject will be positioned towards the right side and for a dark subject, it would be the exact opposite.
Different Histogram Situations
As a photographer, you will have to deal with many types of light. So, the histogram of the picture will not be same for all the photos. So, let us explore some of the commonly seen histogram shapes corresponding to different types of photos and what they tell you.
Histogram of an Underexposed Image
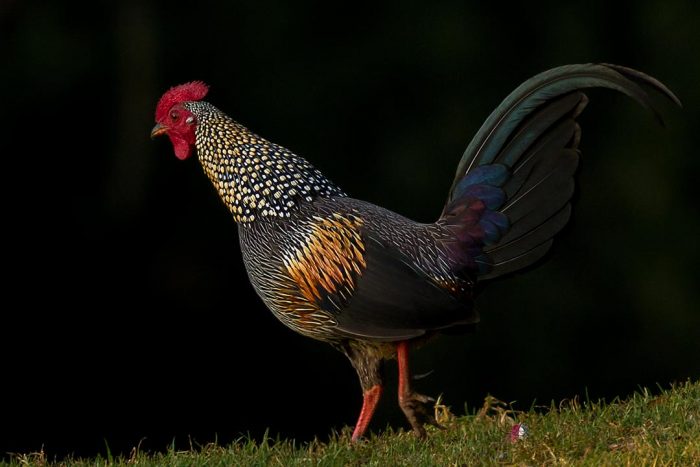
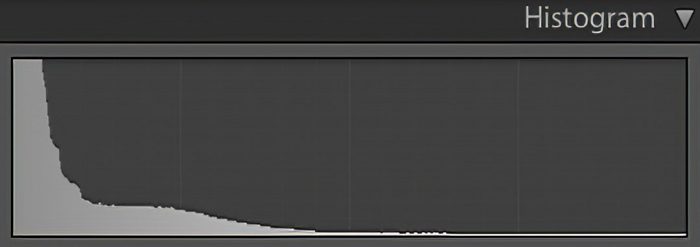
A low key image of the Grey jungle fowl bird is a good example for an underexposed image. The histogram for an underexposed image will be shifted to the left side of the graph as shown. It indicates that darks and shadows are present in the image.
Image & Histogram of an Overexposed Image
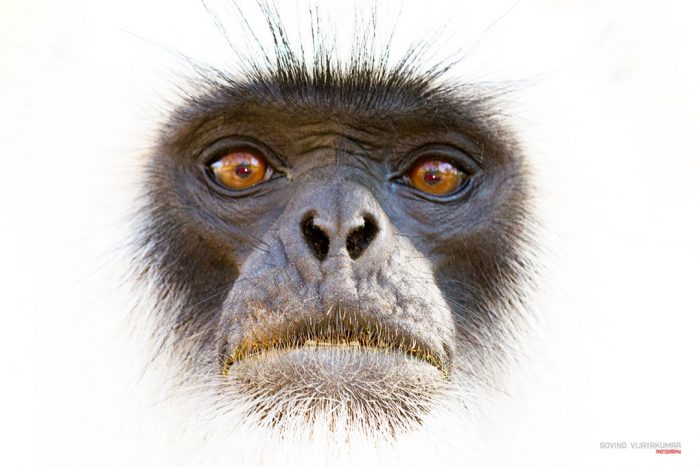
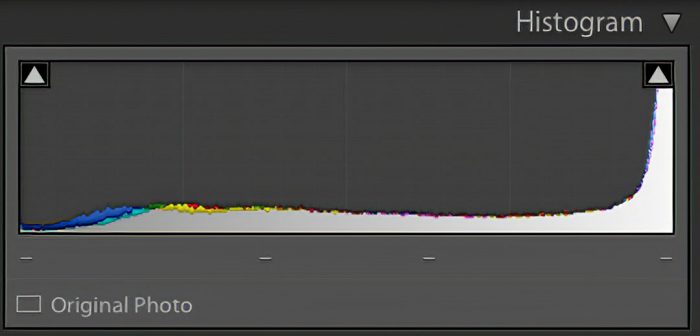
A High Key image of a Grey Langur is a good example for Overexposed image. Here, the camera histogram gets shifted toward right side, as the picture has more Whites and Highlight tones.
Image & Histogram of a Correctly Exposed Image
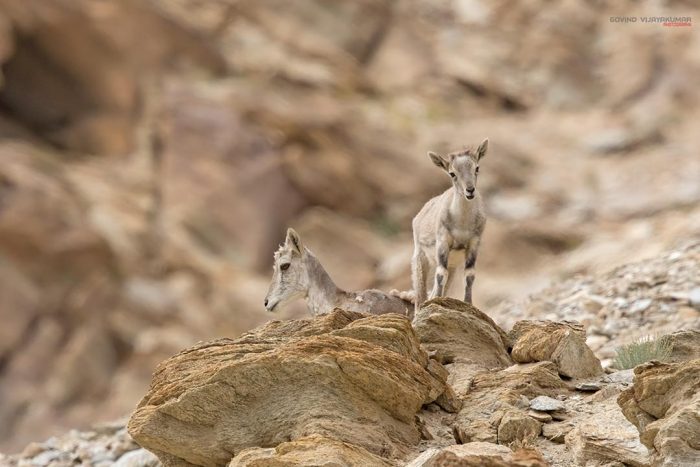
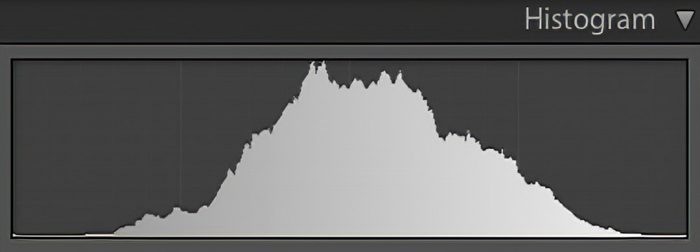
The image of the Blue sheep with its young one is taken at zero exposure (correct exposure). Here, the Histogram will be evenly distributed, with majority part lying in the Midtones section.
Image & Histogram of a High Contrast Image
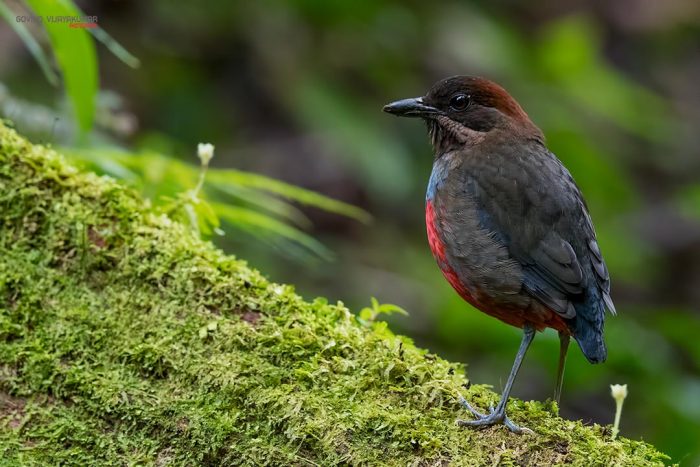
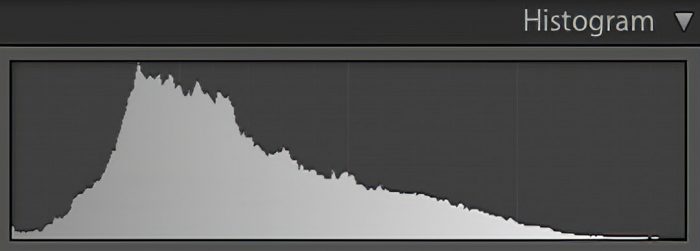
A high contrast image of a Whiskered pitta bird is taken as an example. Here, the Histogram will be spread across the entire graph as shown.
Histogram of a Low Contrast Image
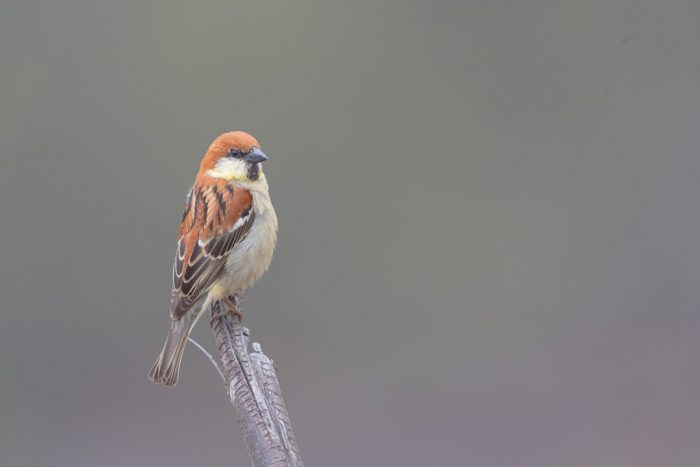
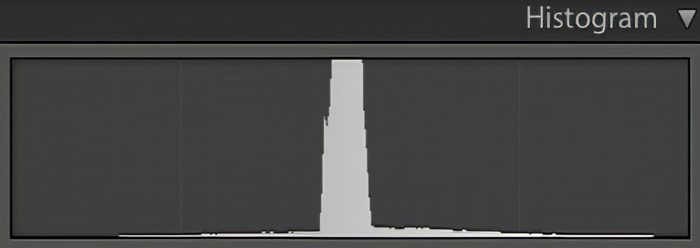
A low contrast image of Russet Sparrow on a broken tree stump is shown above. Here, you can see the Histogram is a slim mountain, distributed at the centre of the graph, indicating more Midtones present in the image.
How to View Histogram of an Image?
You can view the histogram of an image in a camera as well as on a computer.
Histogram in Camera 📷
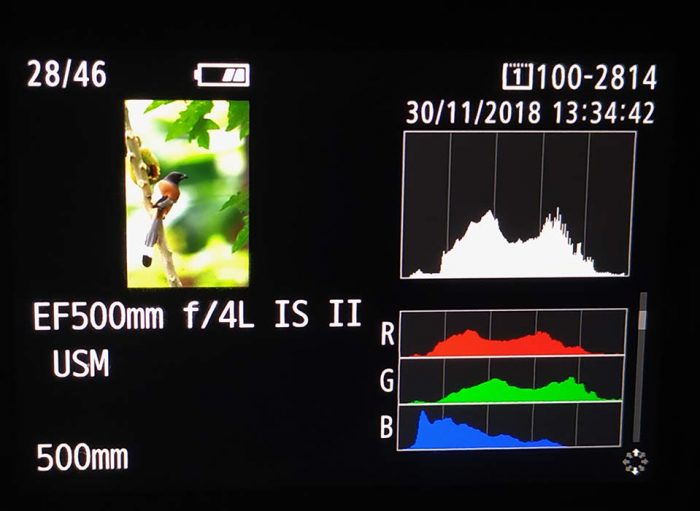
Most DSLR and Mirrorless cameras will have an “Info” button. You need to select the image and click the info button to view the RGB histogram and the luminance histogram.
If your camera doesn’t come with an Info button then you need to refer to the camera manual to see which button does this job.
Histogram in Computer 🖥
Adobe Camera RAW
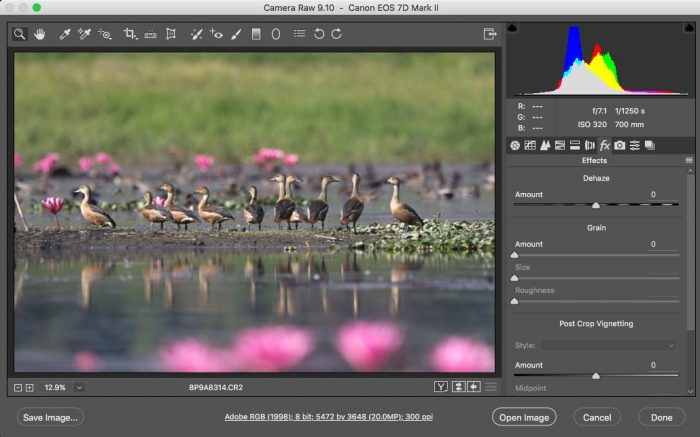
If you are shooting images in RAW format, then when you can try to open the image in Adobe Photoshop. The image will be open in Adobe Camera RAW.
The histogram for this image will be shown on the top right corner, in the control panel.
It will show both RGB histogram as well as the brightness histogram.
If you want to shift the histogram toward left or right then you need to click and hold the X-axis of the histogram and move it to either of the direction to shift the histogram.
It will result in increase or decrease in exposure of the image, depending on the direction of mouse movement.
Adobe Photoshop
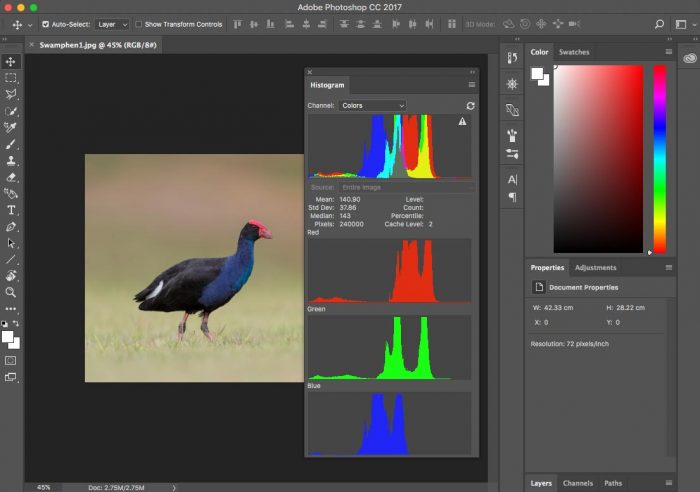
If your image is in TIFF or JPEG format, then you can open it in Adobe Photoshop. Click “Window” option and select the “Histogram” option from the drop-down menu.
You can see a pop-up window with histogram details of the image. Here, you will have the option to select the Luminance histogram as well as RGB histogram.
You can also view the histogram of individual primary colors, Red, Green and Blue separately.
Adobe Lightroom
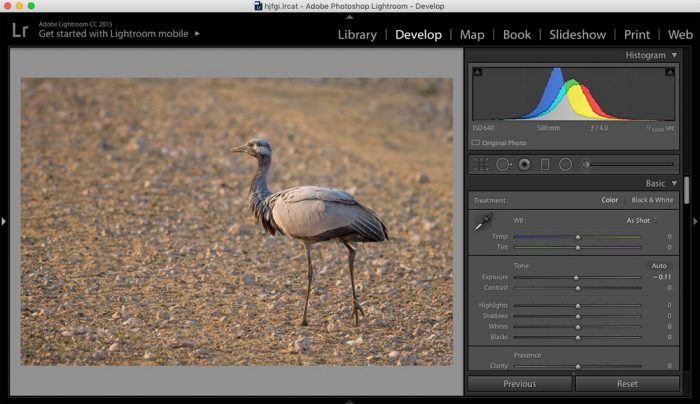
Most of the photographers will be using Adobe Lightroom for photo editing.
You can see the histogram of an image in Lightroom after importing the image into it. It will shown in the top right corner of the control panel.
You can see both RGB histogram and brightness histogram together in an overlapped fashion.
You can alter the Histogram by clicking and holding the X-axis and moving the cursor to the left or right. In order to do this, you should be in the Develop module.
You can control the Midtones, Shadows, Highlights, Darks and Whites separately by selecting the respective sections and pulling it.
Conclusion
I would recommend you to check the image histogram after taking a photograph. It will give you an idea whether you are missing any details in the light or dark sections of the image.
Thus, you can adjust your exposure accordingly. It will also help you to choose the right camera metering technique for the given lighting condition.